
Abstract
This work presents the experimental research carried out to optimize a current computational software “CorOns”, to obtain a better ship hull electrical signature modelling. Middle-term ageing (597 days) of anticorrosion paints, highlights the appearance of additional corrosion processes, despite an absence of visual defects. A specific model is proposed for an aged surface in seawater based on Electrochemical Impedance Spectroscopy (“EIS”) data analysis. We also investigate the impact of the interruption of cathodic protection on the corrosion process, with the objective of modelling the electrical signature in real conditions that could be encountered. These studies’ interruption of the cathodic protection during 24 h, do not seem to have an impact on the current densities. However, EIS studies, highlight that the protection interruptions damage the calcareous deposit, well-known for it is protective effect once formed.
Introduction
In recent decades, research for the optimization of corrosion protection systems has focused on both the reduction of energy consumption and the electromagnetic discretion of ships1,2,3,4. The main sources of the electromagnetic signature of ships is corrosion processes and corrosion protection systems1,2,3.
Because of these processes, naval vessels can be detected especially with new generation of weapons such as the so-called “smart-mine”, developed since World War II. Therefore, over the last decades, many research projects have been working to reduce this signature with cathodic protection system optimization thanks to computational tools3,4,5,6.
To protect ships from natural corrosion processes, several layers of anticorrosion paint are used as well as the Impressed Current Cathodic Protection (ICCP) and Galvanic Anode (GACP) in the most sensitive areas. Two conditions are identified as sources of electric fields in the hull environment of ships:
-
-
Natural process of galvanic corrosion between less noble areas of the hull (defects) considered as anodic part and the propellers or bow thrusters, which are usually made of more noble materials forming the cathode electrodes (Fig. 1A). For example, Nickel Aluminum Bronze (NAB), are often used as propeller material.
Fig. 1: Illustration of the major causes of electrical signature of ship’s hull. 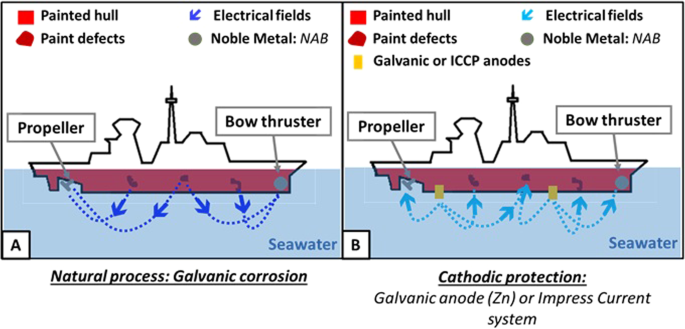
There are two cases, the natural and spontaneous phenomenon, the galvanic coupling illustrated in (A), and the process of cathodic protection illustrated in (B) with the case of Impress Current Cathodic Protection system (ICCP)4.
-
-
Under cathodic protection conditions when an electric field is emitted from the injection anodes and/or galvanic anodes to metallic areas (propellers or defects on the hull represented by unpainted steel) (Fig. 1B).

Numerical modelling of the propagation of electromagnetic fields1,2,3,5,6,7,8,9 often gives a representative prediction of the electromagnetic signature of ships. The CorOns solver, based on the Boundary Element Method has been developed in this context by the G2elab laboratory. The novelty of this solver is the coupling of BEM method with equivalent circuit7,8. Like many modelling software, it demands experimental studies especially for the interfaces’ representation and their evolution according to different corrosion scenarios encountered in real conditions.
Among the different scenarios investigated, the behavior of hull under natural and accelerated ageing conditions is studied with a focus on the unpainted area (defects). These results will be integrated as boundary conditions in the computational software “CorOns”7,8. One of the points discussed in this article, is the verification of certain assumptions generally used in modelling software to represent the different metal/electrolyte interfaces under cathodic protection. The verifying assumption presented here, concerns the painted steel modelling by a pure insulator when no visible defect is observed (i.e., unpainted area)2,3,10.
The novelty of this presented article concerns the evolution of the well-known calcareous deposit under cathodic protection interruptions. The behavior of steels, often carbon steel for hull application, in marine environment under cathodic protection, has already been the subject of numerous studies11,12,13,14,15,16,17. However, rarely studies are focused on the impact of the cathodic protection interruption on the electrochemical behavior of the interface. The idea is to evaluate if this calcareous deposit, whose protective properties by “barrier effect”, could be improved according to the “pulse method effect” described by Zamanzade et al.18. This can represent another source of electrical signature modification of the vessels.
In this context, electrochemical impedance spectroscopy (EIS) under cathodic polarization and potentiodynamic polarization curves and potentiostatic measurements are carried out associated with spectroscopic investigation allowing to characterizing the undamaged and damaged hull in synthetic seawater.
Results and discussion
In this part, the exploitation of impedance diagrams with the development of Electrical Equivalent Circuits “EEC” model, are presented, in order to distinguish the various phenomena at metal/electrolyte interfaces and their evolution.
Freshly painted DH36 steel without defect
The Nyquist Diagram in Fig. 2A, illustrates a high capacitive behavior with imaginary part of the impedance higher than 200 GΩ.cm2 at 20 mHz in agreement with several works19,20, suggesting high protective properties of the coating. Furthermore, the semicircle shape of the Nyquist diagram confirms the presence of a resisto-capacitive phenomenon presented on the proposed equivalent model Fig. 3. This observation is confirmed with the Bode diagram in Fig. 2B, which is corrected from the ohmic drop considered as equal to electrolyte resistance “Re”21.

The imaginary part (Z(img)) is plotted in function of the real part (Z(Re)) of the impedance for the Nyquist diagram in (A). The modulus (black curve) and phase (red curve) are plotted in function of the frequency in (B). Both diagrams are corrected by the Re (Electrolyte resistance), with the modelling result obtained from the EEC presented in (Fig. 3, straight lines) and the power low model implemented in the SIMAD® software, at 20 °C under static condition and in naturally aerated solution.
A constant phase close to 90° between 50 Hz and 10 kHz (Fig. 2) is observed, which suggested a capacitive behavior19,20. This assumption is supported by the very high modulus values obtained in the same frequency domain: from 10 MΩ.cm2 (10 kHz) to 10 GΩ.cm2 (50 Hz) and higher below 50 Hz. The high modulus of over 10 GΩ.cm2 at high frequency (10 kHz) suggests that the paint layer and its strongly protective dielectric properties can mask other electrochemical processes despite the ohmic drop corrections in the diagram. That is why, in our equivalent model (Fig. 3, Electrical Equivalent Circuit model, EES), only one time constant related to the dielectric properties of the paint is considered as faradic phenomena is not observed (double-layer capacitance and transfert resistance). These observations are in good agreement with a freshly painted anticorrosion protective coating behavior has reported in other studies19,20,22. In this case, it is possible to modelling this interface by a single resisto-capacitive phenomenon (Fig. 3).

It illustrates the case of a freshly painted, defect-free sample immersed in seawater after 2 h at OCP (Open Circuit Potential), at 20 °C in static condition and natural aeration.
Furthermore, the single slope close to unity for the modulus vs frequency (Fig. 2B) and the independence of the phase with the frequency is typical of a CPE (Constant Phase Element) behavior21. CPE is often used to accommodate heterogeneities at the interface and especially in our case; it can refer to thickness heterogeneities of the paint leading to a time constant dispersion. In this case, a normal dispersion has been considered with the use of the Power-Law model23 to model this CPE (Eq. 1).
The Power-Law impedance model for a CPE with a normal distribution is given in Eq. (1) and takes into account: resistivity dispersion (ρ(x)) among the paint thickness (δ) thanks to the integral function23, the dielectric properties of the paint with a paint permittivity (ε) and the vacuum permittivity (ε0) equal to 8.854 × 10⁻¹⁴ F.cm−2. In this work, the paint is mainly made of epoxy resin, so we consider a constant permittivity (ε) of 3.6 for an epoxy-based paint21. The pulsation “ω” is considered equal to 2πf with f which representing the pulse frequency. This model considers the variation of the resistivity of the paint contrary to the simpler model still widely used and yet controversial of Hsu-Mansfeld24, which considered the resistance of the paint as independent of the resistance of the electrolyte. This assumption is not valid in our case presumably because the resistance is linked to the porosity of the paint, and this resistance depends on the electrolyte unlike the capacitance, which depends on the dielectric characteristics of the paint itself21. Therefore, we use this Power-Law model to model the CPEpaint. In Fig. 2, we can observe a good agreement between the experimental points and the modelling of the impedance diagrams (Nyquist and Bode Fig. 2A, B respectively) with the EEC Power-Law model obtained with SIMAD® software validating the chosen EEC to represent a freshly paint hull.
Thanks to this model, a value of the porosity resistance (Rporosity) is estimated at around 2.2 × 10+12 ± 5.6 × 10+11 Ω.cm2. The very high value of this Rporosity confirms once again the very protective and insulating character of this freshly deposited paint. The capacitance (Cpaint) is estimated (Eq. 2) from the thickness of the paint (δ) considering the vacuum permittivity (ε0) and the paint permittivity (ε) used for the Power-Law model (Eq. 1)21.
As the thickness of the paint is around 400 ± 150 µF, the capacitance is estimated equal to 8.1 × 10⁻⁶ ± 2.6 × 10⁻⁶ µF.cm−2. This value is consistent with the value of 6 × 10⁻⁶ µF.cm−2 reported in the book of Orazem Mark and Tribollet for an epoxy cast resin21, confirming again the freshly painted carbon steel model presented in Fig. 3. Following these characterizations of a freshly painted sample, ageing measurements in synthetic seawater during 597 days are also analyzed.
Natural ageing of paint
The surface area investigated for this ageing test is larger than the one of the samples used for freshly painted electrochemical characterization (4.52 cm2 vs to 2.2 cm2 for freshly painted carbon steel) presented in the section “Experimental conditions” and used as reference for this study. Despite a larger area, a low current densities in the order of pA.cm−2 are measured, close to the detection limit of potentiostat. In order to accelerate ageing of the paint, anodic and cathodic overpolarizations at ±2 V vs Ecorr are imposed, a well-known ageing technique in the literature25,26. These overpolarizations are carried out during three days at the beginning of the test (T0 + 2 days, 3 days, and 6 days) and increase slightly the current densities (up to 10 pA.cm−2).
EIS results show as already reported in the results of other studies19,22, a decrease of the low-frequency modulus (Fig. 4A) accompanied by a shift of the phase towards higher frequencies (Fig. 4B) with time. This behavior is characteristic of a loss of the barrier properties of the paint related to a progressive adsorption of water19,26.

The modulus in (A) and phase in (B) are plotted as a function of frequency, in artificial seawater at 20 °C, under natural aeration and static conditions.
The interaction of seawater with the paint could lead to long-term degradation of the coating with the detachment of the paint from the metal substrate. This degradation is observed after the 597-days measurement as shown on the cross-section images obtained by backscattered electron imaging of the sample showing a lack of adherence of the paint (Fig. 5B). This detachment is not noticed for a freshly painted sample (Fig. 5A). No blister or other visual defects are observed at the surface of sample after running the experiment.

In (A), the case of freshly painted DH36 steel without defects and, in (B), a painted DH36 steel aged after 597 days of immersion. Both are immersed in artificial seawater at 20 °C naturally aerated in static condition. These images are obtained by Energy Dispersive X-ray Spectroscopy (EDS) using a Backscattered Electron Detector (BED).
To model the aged painted metal/electrolyte interface and its time evolution, the same model as the one used for a freshly painted paint is proposed with the use of the Power Law as well. It appears that this model is valid for up to 48 days. The estimation of the EEC components (Fig. 3) confirm the degradation of the coating with a progressive reduction of Rporosity and the increase of the parameter of the CPE (Q), which illustrate the loss of the barrier properties of the paint along time as shown in Table 1. The impedance of CPE (ZCPE) depends on its two characteristic parameters, (α) and (Q) (Eq. 3)21:
After 48 days, this model cannot be used anymore, as a second time constant appears. This second time constant is modelling by a resisto-capacitive element consisting of a non-ideal capacitance (CPE) and a resistor in parallel. A “α” parameter of about 0.5 is measured suggesting a porous electrode behavior as detailed by several authors21,27. This shows unambiguously infiltration of water through the paint to the metallic interface.
As a reminder, this first study focuses on the representation of painted steel surfaces in computational tool like CorOns. Generally, in the literature3,Full size image
This outer layer should have better barrier properties in comparison with the Mg-hydroxides-rich inner layer, according to the review of Carré et al.13. As a result, a decrease in current densities should be observed12,13,14. Here, we do not observe a clear decrease in current densities Fig. 7 suggesting a partial covering of the surface.

The "black curve" represents the current density in function of the time for continuous cathodic polarization with the topography of the sample surface after 4 days and 7 days (SEM pictures), and the "red curve" represents the current density in function of the time for interrupted cathodic polarization. Both cases are realized at 20 °C, natural aeration conditions and static conditions.
We do observe the first layer rich in magnesium hydroxides/corrosion products that is present at the interface between the agglomerate and the metal surface, as seen in Fig. 6B, D. The Mg map**, despite being very noisy, is seem to show high concentration of magnesium at the base of the agglomerates: very thin layer <2 µm (Fig. 6B). All these observations are consistent with the literature, which investigate the formation of a calcareous deposit and its corrosion barrier properties12,13,14,17.
This observation is confirmed by the EIS measurements which showed an increase in modulus at low frequency with the growth a progressive recovery of the calcareous deposit on the surface (Fig. 8A). In parallel, the phase decreases (loss of the capacitive behavior) and after 4 days under cathodic polarization two peaks can be distinguished at high frequency between 1 kHz and 10 kHz and at intermediate frequency, 1–10 Hz (Fig. 8B). This suggests, at least two times constants, which can be related to the faradic phenomena at the seawater/metal interface and to the dielectric properties of the calcareous deposit. In some works11,12, two layers of the calcareous deposit are distinguished by impedance spectroscopy, but in our case, the calcium carbonate layer (outer layer) might not cover the whole surface of the sample.

The modulus in (A) and phase in (B) are plotted in function of the frequency and corrected for Re (electrolyte resistance). Measurements are made after 1 h, 12 h, 36 h, 84 h, 108 h, 132 h, and 168 h of immersion at 20 °C, under static condition and natural aeration.
This may explain the single high-frequency contribution (1 kHz to 10 kHz) attributed to the deposit. The EEC proposed, is a double “R // CPE” system in parallel as represented in Fig. 9, as suggested by the semicircle shape of EIS diagram on Nyquist representation Fig. 1021. A diffusion impedance (Warbrug model31) is added in series with the transfer resistance because, at this applied potential (−0.8 V vs SCE) according to the polarization curve (Fig. 7) the system is limiting by oxygen diffusion13,14,17.

This EEC model is valid at room temperature, under static conditions, and with artificial naturally aerated seawater.

Imaginary (Z(img)) is plotted in function of the real parts (Z(Re)) of the impedance, under static, at 20 °C in natural aeration and static conditions, after 1 h, 1 day, 4 days and 7 days of continuous cathodic polarization.
Impedance spectra (Fig. 9) show quite great superposition between EEC fit and the experimental data, as presented with the Nyquist diagram Fig. 10. In the model Fig. 9, we consider a dispersion of time constants based on the heterogeneities in terms of thickness, composition, and covering of the deposit and this covering on the metal surface, consequently a CPE is used rather than pure capacitance. For the fitting of the intermediate phenomenon attributed to faradic phenomenon, an estimation of the capacitance value and resistance and its evolution during the 7 days is done thanks to the use of EC-LAB® software. These phenomena are represented by a double-layer capacitance and a charge transfer resistance related to the oxygen reduction reaction.
To estimate the double-layer capacitance value, the Brug’s equation law is used for the faradic phenomena21. Indeed, we consider a surface distribution of the time constants because of the geometric irregularities of the interface observed due to the presence of calcareous deposit. Characteristic range value for a double-layer capacitance according to Loveday et al.32 and Tribollet and Orazem book21, is between 50 and 100 µF.cm−219. Figure 11 shows the progressive decrease of the double-layer capacitance and the increase of the charge transfer resistance suggesting the progressive growth of the calcareous deposit and the progressive covering of the surface. However, the capacitance remains quite high, between 70 and 50 µF.cm−2 during the first 4 days. A capacitance value of this range suggests an active surface, i.e., the formed deposit is not enough for covering and dense to limit the corrosion process21. Hence, the EEC model could be simplified for the first few days of immersion neglecting Cdeposit and Rporosity (Fig. 11A).

Double-layer capacitance (Cdl) estimated with the Brug law’s in (A) and a charge transfer resistance (Rt) in (B) in function of time and estimated from EIS data measured with EC-LAB® software modelling, in static conditions, natural aeration, and 20 °C.
Following these first observations, we also study the impact of the stop of the cathodic protection on this calcareous deposit. For this purpose, 24 h stops of the cathodic protection are carried out on the 5th day (96–120 h period) and the 7th day (144–168 h period) with a restart on the 6th day (120–144 h period). At the end of the first 24 h of stop, the impedance response is represented by the red curves in Fig. 12. During the 6th day, the cathodic protection is restarted and after 24 h (T0 + 144 h), the green curve is obtained (Fig. 12).

The modulus in (A) and phase in (B) are plotted in function of the frequency and corrected from the “Re” (Electrolyte Résistance), for unpainted DH36 steel immersed in naturally aerated artificial seawater and in static conditions at 20 °C.
Consequently, to the stop of the cathodic protection system, a degradation of the metal/deposit interface is noticed with a detachment of the calcareous deposit (Fig. 6B). This loss of adhesion is not observed in the case of samples continuously polarized during 7 days.
However, the structure of the calcareous deposit is similar with an inner layer made of Mg(OH)2 and an outer layer made of CaCO3 agglomerated, according to the EDX/MEB map** performed on both types of samples. The calcareous deposit formation steps do not seem disturbed by these interruptions allowing using the same EEC model (Fig. 9) to represent our interface.
Loss of protective properties of this deposit is observed by impedance spectroscopy. The Bode diagram shows a gradual increase of the 10 mHz modulus during the first 4 days (Fig. 12A) suggesting the formation and the progressive covering of the surface by the calcareous deposit. The phase variation (Fig. 12B), indicates at least two times constants with: after 4 days under cathodic protection, a phenomenon relaxing between 0.1 Hz and 10 Hz, which could be attributed to the faradic phenomena and at high frequencies, around 10 kHz, another phenomenon that would correspond rather to the more and more covering deposit. These observations are in agreement with those made on a 7-day polarization presented previously.
However, in this case, both contributions are clearly distinguished after the first 24 h cut-off. Indeed, a first peak, associated to the dielectric properties of the calcareous deposit between 100 Hz and 1 kHz, which do not change, whereas the second phenomenon (between 0.1 Hz and 10 Hz) would be associated with the faradic process, seem to shift towards lower frequencies. This indicates an acceleration of the corrosion process which could be related to the embrittlement of the calcareous deposit and a loss of its corrosion barrier properties.
The presence of two times constants, as in the continuous polarization case, reinforces the hypothesis of using the same EEC model (Fig. 9) and is further confirmed by great correlation between experimental and modeled data. Considering this model (Fig. 9), we have investigated the impact of the cut-off on the faradic contribution and the evolution of the double-layer capacitance, the faradic impedance, and the diffusion phenomenon.
Figure 13 reports the evolution of the capacitance, the charge transfer resistance and “σw”, the Warburg impedance characteristic parameter describes by Diard et al.31.

The modulus in (A) and the phase in (B) are plotted in function of the frequency during 7 days of cathodic polarization with 2 days of interruptions (5th and 7th days) for an unpainted DH36 steel immersed in naturally aerated artificial seawater, under static conditions at 20 °C.
During polarization stops, “Rt” is replaced by a global faradic impedance “Zf” at open circuit when the system is not limited by only on phenomenon21, as general corrosion takes place at Ecorr. In this case, it will be more relevant to use a global impedance representing all the processes.
This modelling of impedance diagrams highlights the loss of calcareous deposit protective behavior with the faradic impedance or “Rt” under cathodic protection, as the phase strongly decreases (almost a decade) after the first 24 h of “ICCP off” (Fig. 14C). Then, it does not increase afterwards, indicating a permanent loss of the barrier properties of this deposit related to an increase of active area due to electrolyte infiltration under the deposit. Consequently, corrosion become localized with the formation of electrochemical cell created between the different aerated areas: for example, between active area under the deposit and the one in uncovered area. This notion of active area associated to moisten zones responsible of localized corrosion is presented in several works, which talk about induce passivation and residual protection after cut-off of the CP system in soil33,34,35,36. In our case, we don’t observe an induced passivation phenomenon during the cut-off period of cathodic protection. Instead, we observe a direct progressive discharge phenomenon seem to be present, related to a residual protection due to the calcareous deposit which is a novelty for this targeted application. According to potential monitoring, we can observe as mentioned in the work of Wang et al.35, that the “potential shift toward less noble direction”, related to the capacitive charging/discharging could be associated with the presence of the calcareous deposit (T0 + 96–120 h period).

The double layer capacitance (Cdl) estimated with Brug’s law in (A), the Warbrug constant for the diffusion phenomenon (σw) in (B), and the charge transfer resistance (Rt) or the faradic impedance (Zf) in (C), for an unpainted DH36 steel immersed for 7 days in a naturally aerated solution, in a static condition at 20 °C.
As observed in Fig. 15, the potential decreases progressively toward the corrosion potential of an unprotected plate estimated around −0.72 ± 0.01 V vs SCE. This discharge phenomenon seems to be shorter after the second CP interruption (T0 + 144 h–168 h period) which can be linked to loss of covering and protecting properties of the calcareous deposit.

Potential ate DH36 surface in the function of the time, at 20 °C, static conditions and in natural aeration condition.
The parameter “σw” in Fig. 14C, corresponding to the Warburg-type diffusion impedance practically disappears (closed to 0) during the interruption phases. This would be consistent with the fact that at open circuit potential, the system would be almost no longer limited by O2 diffusion in correlation with the loss of the protection efficiency.
The double-layer capacitance values measures, after the 24-h cathodic protection interruptions, were very high around 100 µF.cm−2 (Fig. 14A). This very high value suggests the presence of additional phenomena, undistinguishable in our conditions of the study. This could be due to the infiltration of seawater under the calcareous deposit as presented in the work of Ben Amor et al.37. This idea is reinforced by estimated values of Cdl around 70 µF.cm−2, which is still very high and characteristic of a total active area when the cathodic protection is reactivated during the 6th day (Fig. 14A). This confirms once again the calcareous barrier properties loss.
From this study, several points are observed that could improve the CorOns computational tool for ship electrical signature simulations:
-
Short interruption of cathodic protection system does not affect current density demand.
-
In the long term, an accelerated degradation of the deposits formed on the surface of the materials could be expected following several interruptions of the cathodic protection system with a possible evolution of the currents and thus the electrical signatures.
